Weekly Austin Real Estate Market Update

Austin Real Estate Weekly Market Update - June 12, 2025

by: Dan Price, Broker at Team Price Real Estate
Austin's leading data analysis brokerage, where data drives exceptional service

Published on: Thursday, June 12, 2025 at 7:05 am

Austin’s Real Estate Market : The Austin housing market continues to evolve, and this week’s data confirms a steady shift in buyer leverage. According to the latest update from Team Price Real Estate, active listings across the Austin-Area MLS have climbed to 17,481—an 8.0% increase year over year. Months of Inventory now sits at 6.21, up 16.8% from this time last year, signaling a broader range of choices for buyers and a deceleration in sales velocity.

The median sold price has declined 1.5% year over year to $431,487, while the average sold price dipped 0.6% to $570,724. With inventory building and pricing adjusting, the landscape is becoming increasingly favorable for well-informed buyers and strategic sellers. For a full, in-depth view of what’s happening across the region, download our comprehensive market update—featuring over 800 pages of up-to-date Austin housing data. 

Image Display
Image

Austin Real Estate Market Overview

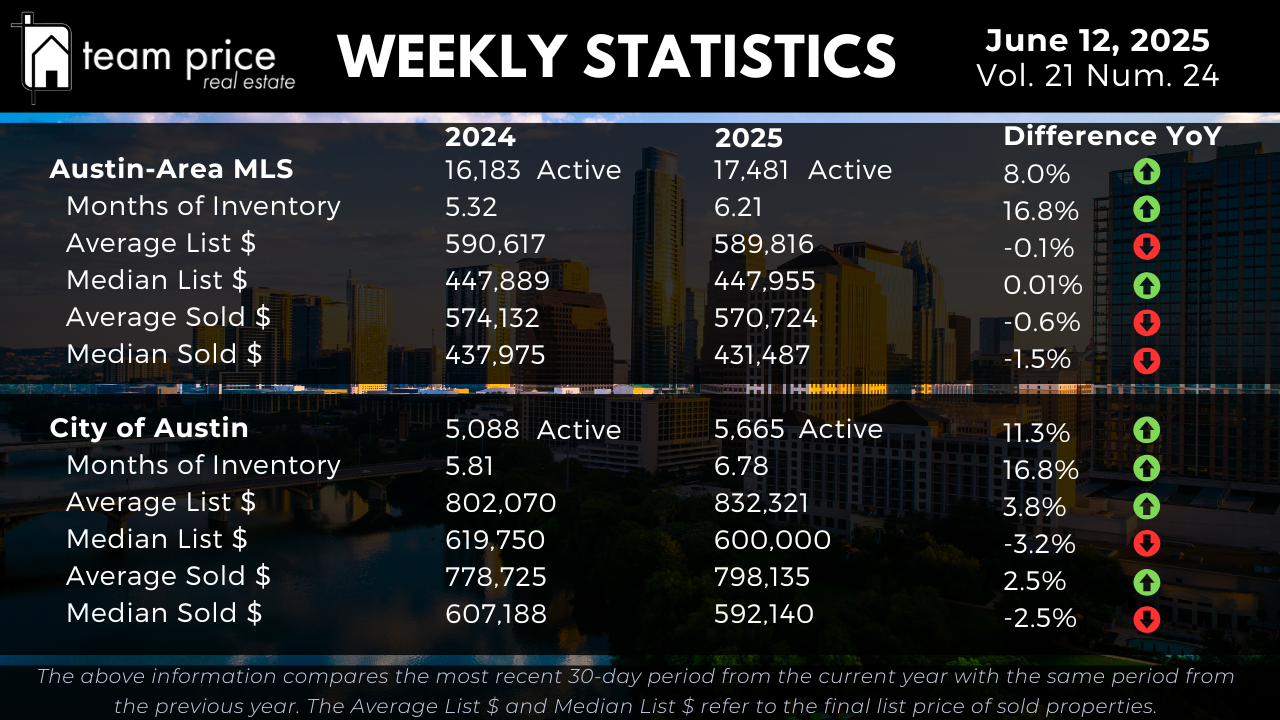
Inventory across the Austin-Area MLS continues to expand. As of this week, there are 17,481 active residential listings—an 8.0% increase compared to the same time last year. Months of Inventory has climbed from 5.32 to 6.21, a 16.8% rise that reflects a steady influx of listings paired with a slower pace of sales. The market now has over six months of supply, suggesting increasingly balanced conditions. Within the City of Austin, the trend is even more pronounced, with active listings up 11.3% year over year to 5,665. Months of Inventory has reached 6.78, up from 5.81 this time last year—a 16.8% gain that reinforces the shift toward longer market times and broader selection. These patterns suggest the Austin market is not undergoing a crash but rather a continued, orderly rebalancing that is affording buyers more options and time.

Austin Housing Prices: Gradual Pressure Builds

Pricing remains under moderate pressure across the Austin-area MLS. The average list price is holding relatively flat year over year at $589,816, reflecting just a -0.1% decline. The average sold price is down slightly to $570,724, a -0.6% year-over-year change. Median figures provide additional context: the median list price is virtually unchanged at $447,955, while the median sold price has dipped 1.5% to $431,487.

In the City of Austin, pricing reflects continued segmentation. The average list price has increased 3.8% year over year to $832,321, likely supported by higher-end inventory. However, the median list price has declined 3.2% to $600,000, indicating softness in mid-range price points. On the sold side, the average price has risen 2.5% to $798,135, while the median has decreased 2.5% to $592,140. This divergence between average and median values highlights how luxury and move-in-ready homes are sustaining price strength, while more dated or overpriced properties are experiencing pushback.

Regional Trends: Price Gains Uneven Across Central Texas

At the regional level, price trends continue to vary by location. Of the 30 cities tracked in Central Texas, 60% posted month-over-month price gains, while 33% experienced declines. However, on a year-over-year basis, only 13 cities (43%) saw price increases, with the remaining 17 (57%) recording declines. Notably, none of the cities are currently priced above their 12-month peak, with 27 showing declines from their recent highs. This points to a broader regional adjustment, particularly in areas that saw aggressive appreciation during the pandemic housing boom.

At the ZIP code level, the market remains mixed. Of the 75 ZIP codes tracked, 37 (49%) saw month-over-month price gains, while 33 (44%) experienced declines. Compared to last year, 33 ZIP codes (44%) have higher prices, while 42 (56%) have declined. Just one ZIP code remains above its 12-month price peak, with the remaining 74 showing pullbacks, reinforcing that the ongoing correction is broad-based across Central Texas.

List-to-Sale Price Performance: Modest Negotiation Continues

As of mid-June 2025, 66.83% of all homes are selling below the list price, an increase from 62.72% the previous month. Properties selling at asking price account for 21.19%, while those selling over list represent just 11.98%—down from 14.86% a month ago and 13.74% in June of last year. The average sold-to-list price ratio stands at 97.40%, reflecting a modest but persistent trend of buyer negotiation. Homes that are priced in alignment with current comparables and market demand continue to draw attention, but many listings face increased resistance without price improvements or condition updates.

Peak Value Trends: Still Well Below the Top

Austin remains significantly below its market peak across all major pricing benchmarks. In the Austin-area MLS, the average list price peaked at $721,059 in April 2025 and now sits at $687,974, a 4.6% drop. The median list price has fallen 11.0% from its May 2022 peak of $539,900 to $480,500. Average sold prices are down 11.1% from their May 2022 peak of $664,515 to $590,594, while the median sold price has dropped more steeply—down 15.4% from $538,000 to $455,000. The average price per square foot has fallen 19.1%, from $324 to $262, and the median has declined 21.1%, from $280 to $221.

In the City of Austin, the story is similar. The average list price reached a high of $956,891 in April 2025 and has since declined 6.9% to $890,825. The median list price is down 14.1%, from $672,000 to $577,500. On the sales side, the average sold price has dipped 3.1% from its May 2022 peak of $847,583 to $821,350, while the median sold price has dropped 10.4%, from $680,000 to $609,500. Price per square foot has also fallen: the average is down 18.1%, from $442 to $362, and the median is down 20.9%, from $393 to $311. These figures underscore the significant reset in valuation that has occurred over the past two years.

Austin Area Residential Sales Insights

Austin Real Estate FAQ : June 12th 2025

1. Is the Austin housing market going to crash in 2025?​

As of mid-2025, the data does not support a housing market crash in Austin, but rather a methodical correction. Active listings across the Austin-area MLS have increased 8.0% year over year to 17,481, and Months of Inventory has risen to 6.21—a 16.8% jump that signals slower sales and more choices for buyers. Median home prices have declined by 1.5% across the region and 2.5% within the City of Austin. While some areas have seen sharper price drops from their 2022 peaks, this market behavior reflects a rebalancing of supply and demand, not a systemic collapse. Austin remains one of the most data-monitored housing markets in the U.S., and current indicators suggest a shift toward buyer-favorable conditions, not a crash.

2. Are home prices dropping in Austin, Texas right now?

Yes, home prices in Austin are still adjusting downward, though the rate of decline has moderated. As of June 2025, the median sold price in the Austin-area MLS is $431,487, down 1.5% year over year. In the City of Austin, the median sold price is now $592,140, representing a 2.5% annual decline. Compared to the market peak in May 2022, median prices across the region are down over 15%. However, the market remains segmented: higher-end properties and well-renovated homes continue to perform, while others are seeing longer days on market and price reductions. The correction appears ongoing but controlled.

3. What is Months of Inventory, and what does it mean for buyers in Austin?

Months of Inventory (MOI) measures how long it would take to sell all active listings at the current pace of sales. It’s one of the most reliable indicators of market conditions. A seller’s market is typically defined as less than 5 months of inventory, while a buyer’s market begins at 7 months or more. As of June 2025, the Austin-area MLS sits at 6.21 months of inventory, indicating a neutral to leaning buyer’s market. In the City of Austin, MOI has reached 6.78. This means buyers now have more leverage, more choices, and are less likely to encounter multiple-offer situations—especially in mid-range and entry-level price points.

4. Why are so many homes in Austin selling below asking price?

Currently, 66.83% of homes in the Austin-area MLS are selling below list price, a reflection of increased inventory and tempered buyer urgency. This trend is a shift from the pandemic-era market where bidding wars were common. With more than six months of supply now available and over half of listings showing price reductions, sellers are more likely to negotiate. The average sold-to-list price ratio is now 97.4%, confirming that price alignment and home condition are key factors in closing deals. Properties that are priced too aggressively relative to their condition or comparables tend to linger on the market until sellers make adjustments.

5. How far have home prices fallen from the peak in Austin?

Home prices in the Austin area have declined substantially from their peak values. The median sold price in the Austin-area MLS is now $455,000, which is 15.4% below the peak of $538,000 in May 2022. Average prices have dropped by over 11% in the same period. In the City of Austin, the decline is similar: the median sold price has fallen 10.4%, and average sold price per square foot is down nearly 19%. These declines reflect a broad regional reset, particularly in neighborhoods and price segments that saw the sharpest appreciation between 2020 and 2022. However, compared to historical averages, long-term appreciation in Austin still trends positive, just no longer at pandemic-era extremes.​