

Austin Housing Market 2025: New Listings Surge Toward Record Levels
Published | Posted by Dan Price
Austin Real Estate Market: New Listings Surge Signals Record-Breaking Year
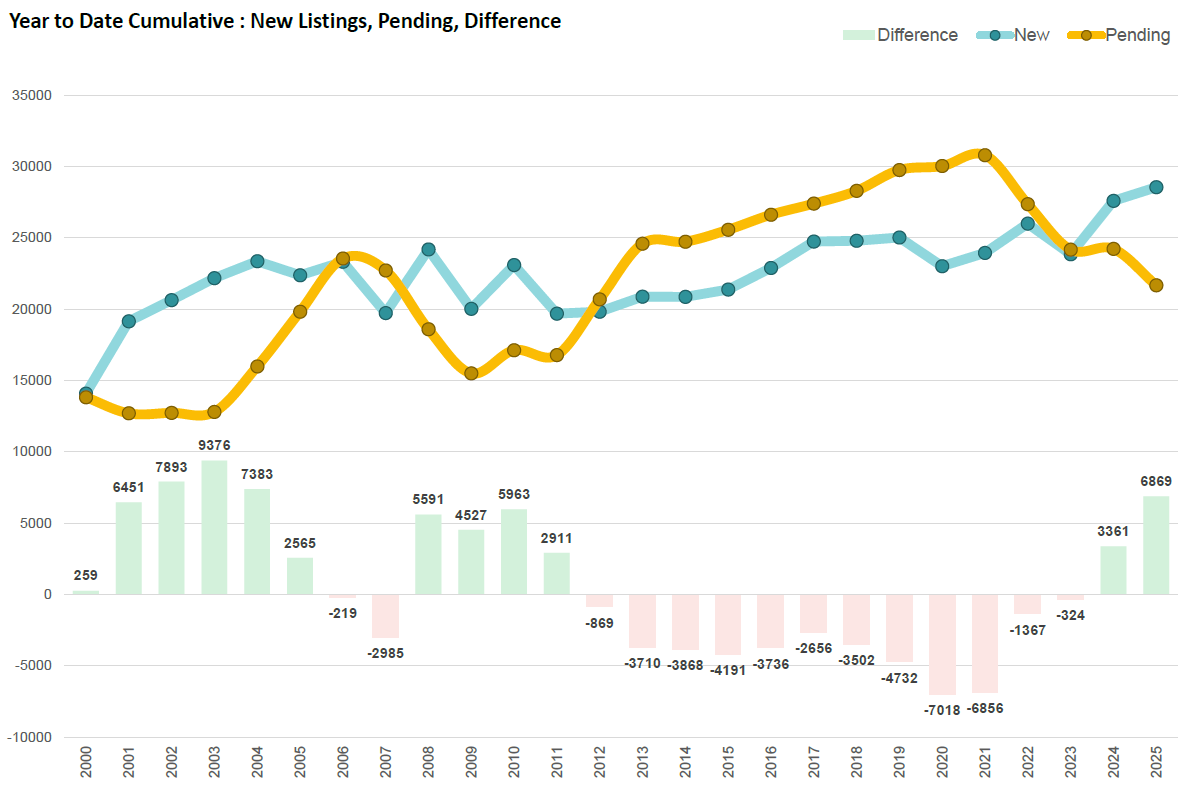
June 23, 2025 : The Austin housing market continues to show significant shifts as the year progresses, with a notable surge in new listings setting the stage for what could be a record-breaking year. Year-to-date cumulative figures reveal that new residential listings across the Austin area have reached 28,535, marking a 3.5 percent increase compared to this time last year. More importantly, this surge places the market 26.8 percent above the long-term average for new listings.
The pace of new listings has not only accelerated compared to recent years but is on track to surpass the previous high recorded in 2004. That year, Austin saw a total difference of 7,383 between new listings and pending sales—a figure that has stood as a benchmark for over two decades. As of now, the difference stands at 6,869, and at the current trajectory, the Austin market is expected to exceed that 2004 record within the next few weeks.
This growth in new listings is happening alongside a notable gap between new listings and pending contracts. Pending listings, which reflect properties under contract but not yet closed, currently stand at 21,666. While pending sales remain strong, they have not kept pace with the influx of new listings, leading to a widening difference. This difference, currently at its highest level since 2004, suggests that inventory levels are building rapidly.
The cumulative new listings figure of 28,535 reflects a consistent upward trend that began in early 2024. For context, Austin’s housing market struggled with inventory shortages during the years following 2013, as shown by the persistent negative differences between new and pending listings from that period through 2022. In several of those years, including 2020 and 2021, the difference dropped to extreme lows of -7,018 and -6,856, respectively, highlighting the rapid absorption of listings during the pandemic housing boom.
Today’s market is a stark contrast to that period. The combination of rising new listings and relatively slower pending activity has resulted in the largest positive difference in over two decades. This pattern signals a growing supply of available homes, contributing to the overall rise in active residential listings across the Austin area, which recently climbed to 17,937—surpassing the previous high of 17,825 recorded just days prior.
While this surge in supply offers expanded choices for buyers, it also reflects underlying shifts in market dynamics. The Activity Index, which measures market demand by comparing pending listings to total active and pending listings, currently sits at 20.4 percent. This indicates relatively subdued buyer demand compared to the supply available. At the same time, Months of Inventory has increased to 6.38, positioning the market within neutral territory and signaling a shift away from the competitive seller’s market conditions seen in recent years.
The historical perspective provided by the year-to-date cumulative data illustrates how the Austin housing market has moved through distinct cycles over the past two decades. In the early 2000s, the market experienced steady growth in new listings, with significant peaks in 2003 and 2004. Following the 2008 financial crisis, new listings and pending sales remained relatively balanced, with modest positive differences.
However, the period from 2013 through 2021 marked a sustained seller’s market, with pending sales consistently outpacing new listings. This dynamic contributed to record-low inventory levels and intensified competition among buyers. The sharp reversal beginning in 2022, characterized by increasing new listings and softening pending sales, has continued into 2025.
As the Austin market enters the second half of the year, all signs point to continued inventory growth. With new listings already outpacing pending sales by nearly 7,000 units, and with that gap expanding, the market appears poised to surpass historical records for cumulative difference between new listings and pending contracts. For buyers, this trend represents improved selection and negotiating power. For sellers, it underscores the need for competitive pricing and strategic market positioning.
The evolving balance between supply and demand, reflected in these cumulative figures, provides valuable insight into the trajectory of Austin’s real estate market. While the coming weeks will determine whether the market officially surpasses the 2004 record, the data already confirms a significant shift toward higher inventory levels and a more balanced marketplace.
FAQ: Austin Housing Market Trends
1. What does the difference between new listings and pending sales mean for the Austin housing market?
The difference between new listings and pending sales indicates how much housing inventory is building up. A large positive difference means more homes are being listed than are going under contract, leading to higher available inventory. This typically gives buyers more options and may lead to price adjustments by sellers.
2. Why is the year 2004 significant in Austin real estate history?
In 2004, the Austin housing market recorded the largest positive difference between new listings and pending sales in the past two decades, with 7,383 more new listings than pending contracts. This year is significant because the market in 2025 is now on track to surpass that figure, signaling a potentially record-breaking year for inventory growth.
3. How does increased inventory affect home prices in Austin?
When inventory rises significantly and buyer demand remains steady or declines, sellers often face more competition, which can lead to price reductions or longer days on market. The current increase in active listings and the widening gap between new and pending listings suggest downward pressure on prices, especially in areas with the highest inventory growth.
4. What is the Activity Index, and what does it tell us about the market?
The Activity Index measures buyer demand by comparing the number of pending listings to the total of active and pending listings. A lower index indicates weaker buyer activity relative to available inventory. The current Activity Index for Austin is 20.4 percent, reflecting subdued demand compared to the growing supply of homes.
5. How do Months of Inventory reflect market conditions?
Months of Inventory estimates how long it would take to sell all active listings at the current pace of sales if no new homes were listed. A figure below 5 months typically indicates a seller's market, while a figure above 7 months suggests a buyer's market. With Austin's Months of Inventory at 6.38, the market is currently balanced but trending toward buyer-friendly conditions.
Request Info
Have a question about this article or want to learn more?
